Memory footprint of popular CPAN modules

I was reading Jay Kuri's article about CGI alternatives the other day, and I got thinking. How much memory does these various modules for simple (or advanced) web serving use? After having looked through Mark Stosberg's article on startup penalties I was even more bewildered. It was hard to track the actual cost of each module, because the perl interpreter footprint was also in there (and that we cannot do anything with). I wrote a small script called perlbloat.pl to check how each of the mentioned modules come out. It uses the GTop module, which is Gnome's cross-platform way of counting things such as memory. The results was from this command: $ for name in $(echo CGI HTTP::Engine FCGI::Engine Catalyst CGI::Application Squatting Continuity Mojo Mojolicious Titanium HTML::Mason CGI::Simple); do perlbloat.pl $name; done
| Module | Memory |
|---|---|
| CGI::Application | 135 168 |
| CGI::Simple | 536 576 |
| Squatting | 540 672 |
| CGI | 602 112 |
| Continuity | 1 163 264 |
| HTTP::Engine | 2 072 576 |
| Mojo | 2 719 744 |
| HTML::Mason | 2 916 352 |
| Mojolicious | 3 526 656 |
| Titanium | 3 559 424 |
| FCGI::Engine | 10 280 960 |
| Catalyst | 11 046 912 |
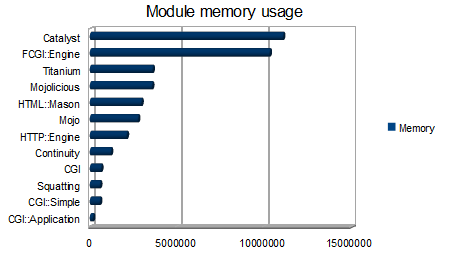
Version numbers are as follows (running on perl 5.10.0 on Ubuntu 8.10): Catalyst 5.80004 CGI 3.29 CGI::Application 4.21 CGI::Simple 1.110 Continuity 1.0 FCGI::Engine 0.08 HTML::Mason 1.42 HTTP::Engine 0.1.8 Mojo 0.9002 Mojolicious 0.9002 Squatting 0.60 Titanium 1.01 What is interesting to notice here is that CGI::Application actually comes out with a lower footprint than CGI::Simple. Considering CGI::Application has a somewhat bigger API this is surprising. There is of course no surprise that Catalyst is the most memory hungry module of them all. What seems surprising, though, is that FCGI::Engine eats so much. It would be nice to know why. If you consider these numbers I would like to know good reasons for using Catalyst in a high-performing environment. To me it seems like the application servers will take a trashing because of the increased memory usage of each process if you compare it to e.g. CGI::Application. Even Titanium which is pretty feature packed comes out at almost three times less memory used. What is interesting to notice is that if you consider the typical deployment scenario for a Catalyst-based app you get these numbers: $ perlbloat.pl Moose DBIx::Class Catalyst Moose added 4.8M DBIx::Class added 392k Catalyst added 5.7M Moose DBIx::Class Catalyst added 10.9M in total If you consider a similar app based on HTTP::Engine you will have this overhead: $ perlbloat.pl Moose DBIx::Class HTTP::Engine Moose added 4.8M DBIx::Class added 396k HTTP::Engine added 1.4M Moose DBIx::Class HTTP::Engine added 6.7M in total If you turn the loading order around a little bit you get this: $ perlbloat.pl DBIx::Class Moose HTTP::Engine DBIx::Class added 528k Moose added 4.7M HTTP::Engine added 1.4M DBIx::Class Moose HTTP::Engine added 6.7M in total What you can see from this last dump is that Moose and DBIx::Class shares some code (132k), but it is mostly irrelevant when you consider the cost of the rest. Another package that is getting wildly popular these days is MooseX::Declare (0.22 tested), and as you can see, it has pretty large footprint aswell: $ perlbloat.pl MooseX::Declare MooseX::Declare added 10.3M If you separate Moose and MooseX::Declare you can see that it adds up by itself (it's not only Moose that costs): $ perlbloat.pl Moose MooseX::Declare Moose added 4.8M MooseX::Declare added 5.4M Moose MooseX::Declare added 10.2M in total If you have something to say about the numbers I've collected here I would love to hear them. Feel free to post comments.